
GIẢI ĐỀ IELTS WRITING CAMBRIDGE 8- TEST 2- TASK 1
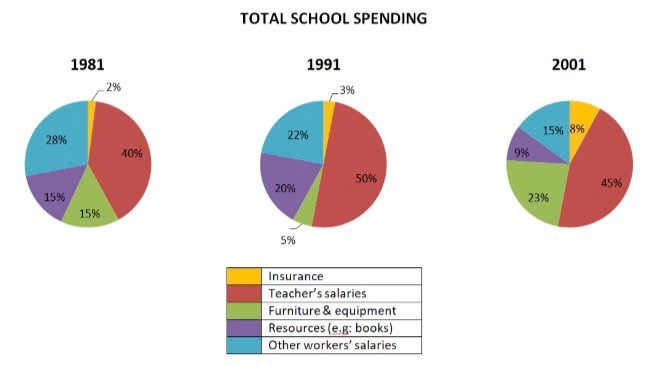
The three pie charts below show the changes in annual spending by a particular UK school in 1981, 1991 and 2001.
Summarise the information by selecting and reporting the main features, and make comparisons where relevant.
ANSWER
| The pie charts illustrate the percentage distribution of annual expenditure by a specific UK school in the years 1981, 1991, and 2001. | Biểu đồ hình tròn minh họa phân phối phần trăm chi tiêu hàng năm của một trường học cụ thể tại Vương quốc Anh trong các năm 1981, 1991 và 2001. |
| Overall, teachers’ salaries consistently accounted for the largest portion of expense in all three years, whereas insurance remained the smallest category. Notable fluctuations occurred in expenditures on resources, furniture and equipment, and other workers’ salaries over the period. | Nhìn chung, lương giáo viên luôn chiếm tỷ trọng chi tiêu lớn nhất trong cả ba năm, trong khi bảo hiểm vẫn là hạng mục nhỏ nhất. Có những biến động đáng chú ý trong chi tiêu cho tài nguyên, đồ đạc và thiết bị, cũng như lương của những người lao động khác trong giai đoạn này. |
| In 1981, teachers’ salaries dominated the school’s budget, comprising 40% of total investment. This figure increased significantly to 50% in 1991, before slightly dropping to 45% in 2001. Meanwhile, other workers’ salaries constituted the second-largest share at 28% in 1981. However, their share declined steadily to 22% in 1991 and further to 15% in 2001. | Năm 1981, lương giáo viên chiếm phần lớn ngân sách của trường, chiếm 40% tổng đầu tư . Con số này tăng đáng kể lên 50% vào năm 1991, trước khi giảm nhẹ xuống 45% vào năm 2001. Trong khi đó, lương của những người lao động khác chiếm tỷ trọng lớn thứ hai ở mức 28% vào năm 1981. Tuy nhiên, tỷ trọng của họ giảm đều đặn xuống 22% vào năm 1991 và tiếp tục giảm xuống 15% vào năm 2001.
|
| An investment in furniture and equipment, in contrast, followed a different trend. Starting at 15% in 1981, it fell to just 5% in 1991 before rising dramatically to 23% in 2001, making it the second-highest fund that year. Similarly, resources such as books saw an increase from 15% in 1981 to 20% in 1991 but then experienced a significant drop to just 9% in 2001. | Ngược lại, sự đầu tư cho đồ nội thất và thiết bị lại theo một xu hướng khác. Bắt đầu từ 15% vào năm 1981, nó giảm xuống chỉ còn 5% vào năm 1991 trước khi tăng mạnh lên 23% vào năm 2001, trở thành khoản chi cao thứ hai trong năm đó. Tương tự như vậy, các nguồn lực như sách đã tăng từ 15% vào năm 1981 lên 20% vào năm 1991 nhưng sau đó đã giảm đáng kể xuống chỉ còn 9% vào năm 2001. |
| Lastly, the proportion allocated to insurance, while consistently low, showed a gradual increase. In 1981, it only made up 2% of the total, rising slightly to 3% in 1991 and reaching 8% by 2001. | Cuối cùng, tỷ lệ phân bổ cho bảo hiểm, mặc dù luôn ở mức thấp, nhưng đã tăng dần. Nó chỉ chiếm 2% tổng số vào năm 1981, tăng nhẹ lên 3% vào năm 1991 và đạt 8% vào năm 2001. |
213 words.
Written by Ms. Ngọc IELTS (W: 7.5)